“If there was ever a bad idea, EMU it is.” Rüdiger Dornbusch
EMU = European Monetary Union
So I’m currently having a look at the performance of some of the economies in Northern Europe after the financial crisis, more specifically the four Scandinavian countries (Denmark, Finland, Norway, and Sweden), the three Baltics (Estonia, Latvia, and Lithuania), and Iceland. The results are quite striking. The economies with flexible exchange rates Iceland, Norway, and Sweden have performed relatively well while the other countries have done mediocre or abysmal. The big difference is, of course, the exchange rate regime. Some of the countries have their exchange rate pegged to the euro (Denmark) or became euro members over the last years (the Baltics) while Finland was already a euro member from the start. Being part of the Eurozone or having a peg to the eure obviously means to give up autonomy on monetary policy. The stance of monetary policy is decided in Frankfurt by the ECB for the entire eurozone. With Germany and France by far being the largest economies these countries also carry the largest weight. It is thus not unlikely that the stance of monetary policy might be completely wrong for a small economy like Denmark or Finland. Milton Friedman first advocated flexible exchange rates in 1953 during the period of Bretton Woods when exchange rates were fixed. However, during that time capital movements were more or less restricted. In our world of free capital flows a country must give up its monetary autnomy if it decided to peg its currency to another currency. This is the so-called trilemma, that you can have only have two out of three possbile choices: capital mobility, monetary autonomy, and a fixed exchange rate. The latter is insofar undesirable because prices are inflexible to different degrees. More specifically, the problem is that nominal wages are sticky downwards so that if the economy is hit by a negative shock, it is output and employment that adjusts. In the words of Friedman:
“Wage rates tend to be among the less flexible prices. In consequence, an incipient deficit that is countered by a policy of permitting or forcing prices to decline is likely to produce unemployment rather than, or in addition to, wage decreases. The consequent decline in real income reduces domestic demand for foreign goods and thus demand for foreign currency with which to purchase these goods. In this way it offsets the incipient deficit. But this is clearly a highly efficient method of adjusting to external changes.”
The benefit of flexible exchange rates is that financial prices can adjust instantaneously, the case of the UK after the Brexit vote being the best example thereof. Leaving the common market is going to have a very detrimental long-run effect on British GDP per capita, which might very well be about 2% lower in perpetuity as a result of this decision. However, the immediate recession predicted by many was a non-event because of the Bank of England’s aggressive monetary policy stance to offset the negative shock. The large depreciation of the British pound made British goods more competitive and consumers moved forward certain purchases as somewhat higher inflation rates will loom in the future. The British economy turned out to be one of the best performers this year among advanced economies as the depreciation of the pound offset the negative shock from the decision on Brexit.
While the advantages of a flexible exchange rate as a shock absorber are relatively straightforward, modern macroeconomics assumes that monetary shocks are only temporary phenomena. Any deviations from equlibirium levels are reverted in the medium run once prices have fully adjusted. However, this assumption seems to be somewhat flawed. Below I will show that the Great Recession seems to have left permanent scars on the economies of Northern Europe that ar epart of the euro system. Blanchard as well as Fatas and Summers more recently have explained that nominal shocks might lead to long-lasting effects because of so-called hysteresis. Some workers might become permanently unemployed and there might be slowdown in physical investment as a result of a recession. These two effects might cast shadow on future growth rates that lasts for a long period. Finally, Summers has also revived the idea of secular stagnation as Western advanced economies have now suffered from a decade of low growth or stagnation. The so-called natural rate of interest rate, a concept that comes from the Swedish economist Knut Wicksell, is the interest rate that is required for the economy to achieve potential output. A number of factors, demographic, technological and structural, have led to a global decline in real interest rates from about 4% in the 1990s to about zero or less nowadays. With the zero-lower bound on nominal interest rates, Central Banks might be unable or unwilling to generate the inflation rate that is required to push down the real interest rate into negative territory. As a result, countries might be demand-constrained for many years. Of course, something’s got to give eventually as to bring the economy back to equlibrium. Over the last years potential output of most advanced economies has been revised downwards several times. The big worry that long-lasting demand-side depressions also cast a big shadow on future growth rates thus seems to have played out.
The countries with monetary autonomy seem to have fared better in recent years if Central Banks eased aggressively enough to offset the various headwinds the global economy has been facing for a decade now. Being able to depreciate their currencies was also helpful as means to restore full employment. Countries pegged to the euro or eurozone countries, on the other hand, did not have the same advantage. Furthermore, the ECB’s monetary policy was highly contractionary during the first years after the financial crisis, which had significant negative effects on the economic performance for the Eurozone as a whole with some countries being more adversely affected than others.
In what follows, I compare the macroeconomic outcomes for Northern European countries mentioned in the beginning of the post (Scandinavia, the Baltics, and Iceland).
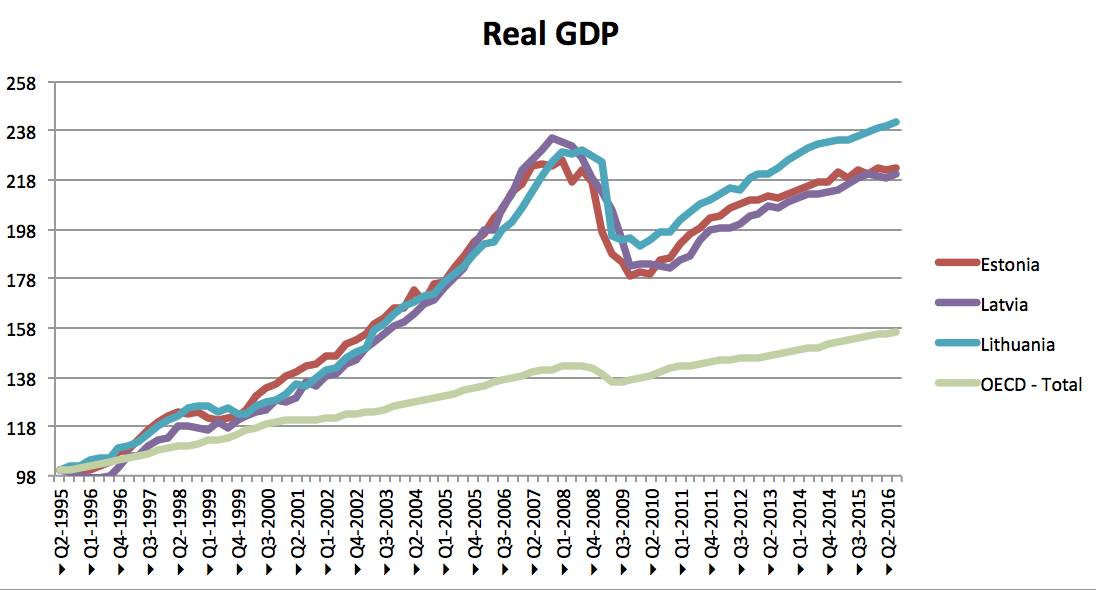
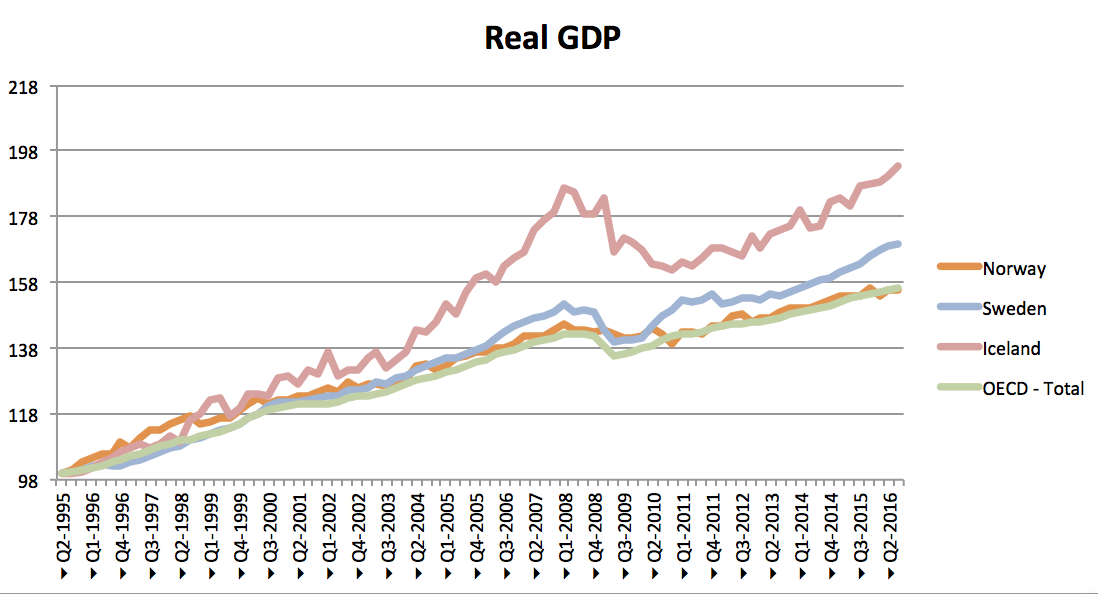
In the next three graphs I have plotted real GDP for the countries under consideration. I have grouped them together as follows: Denmark and Finland (the first one being part of the European Exchange Rate Mechanism and the other one being a Eurozone country), the three Baltics, and the three countries with flexible exchange rates. I have also always included a series that plots the average real GDP for the group of OECD countries.
EMU = European Monetary Union
So I’m currently having a look at the performance of some of the economies in Northern Europe after the financial crisis, more specifically the four Scandinavian countries (Denmark, Finland, Norway, and Sweden), the three Baltics (Estonia, Latvia, and Lithuania), and Iceland. The results are quite striking. The economies with flexible exchange rates Iceland, Norway, and Sweden have performed relatively well while the other countries have done mediocre or abysmal. The big difference is, of course, the exchange rate regime. Some of the countries have their exchange rate pegged to the euro (Denmark) or became euro members over the last years (the Baltics) while Finland was already a euro member from the start. Being part of the Eurozone or having a peg to the eure obviously means to give up autonomy on monetary policy. The stance of monetary policy is decided in Frankfurt by the ECB for the entire eurozone. With Germany and France by far being the largest economies these countries also carry the largest weight. It is thus not unlikely that the stance of monetary policy might be completely wrong for a small economy like Denmark or Finland. Milton Friedman first advocated flexible exchange rates in 1953 during the period of Bretton Woods when exchange rates were fixed. However, during that time capital movements were more or less restricted. In our world of free capital flows a country must give up its monetary autnomy if it decided to peg its currency to another currency. This is the so-called trilemma, that you can have only have two out of three possbile choices: capital mobility, monetary autonomy, and a fixed exchange rate. The latter is insofar undesirable because prices are inflexible to different degrees. More specifically, the problem is that nominal wages are sticky downwards so that if the economy is hit by a negative shock, it is output and employment that adjusts. In the words of Friedman:
“Wage rates tend to be among the less flexible prices. In consequence, an incipient deficit that is countered by a policy of permitting or forcing prices to decline is likely to produce unemployment rather than, or in addition to, wage decreases. The consequent decline in real income reduces domestic demand for foreign goods and thus demand for foreign currency with which to purchase these goods. In this way it offsets the incipient deficit. But this is clearly a highly efficient method of adjusting to external changes.”
The benefit of flexible exchange rates is that financial prices can adjust instantaneously, the case of the UK after the Brexit vote being the best example thereof. Leaving the common market is going to have a very detrimental long-run effect on British GDP per capita, which might very well be about 2% lower in perpetuity as a result of this decision. However, the immediate recession predicted by many was a non-event because of the Bank of England’s aggressive monetary policy stance to offset the negative shock. The large depreciation of the British pound made British goods more competitive and consumers moved forward certain purchases as somewhat higher inflation rates will loom in the future. The British economy turned out to be one of the best performers this year among advanced economies as the depreciation of the pound offset the negative shock from the decision on Brexit.
While the advantages of a flexible exchange rate as a shock absorber are relatively straightforward, modern macroeconomics assumes that monetary shocks are only temporary phenomena. Any deviations from equlibirium levels are reverted in the medium run once prices have fully adjusted. However, this assumption seems to be somewhat flawed. Below I will show that the Great Recession seems to have left permanent scars on the economies of Northern Europe that ar epart of the euro system. Blanchard as well as Fatas and Summers more recently have explained that nominal shocks might lead to long-lasting effects because of so-called hysteresis. Some workers might become permanently unemployed and there might be slowdown in physical investment as a result of a recession. These two effects might cast shadow on future growth rates that lasts for a long period. Finally, Summers has also revived the idea of secular stagnation as Western advanced economies have now suffered from a decade of low growth or stagnation. The so-called natural rate of interest rate, a concept that comes from the Swedish economist Knut Wicksell, is the interest rate that is required for the economy to achieve potential output. A number of factors, demographic, technological and structural, have led to a global decline in real interest rates from about 4% in the 1990s to about zero or less nowadays. With the zero-lower bound on nominal interest rates, Central Banks might be unable or unwilling to generate the inflation rate that is required to push down the real interest rate into negative territory. As a result, countries might be demand-constrained for many years. Of course, something’s got to give eventually as to bring the economy back to equlibrium. Over the last years potential output of most advanced economies has been revised downwards several times. The big worry that long-lasting demand-side depressions also cast a big shadow on future growth rates thus seems to have played out.
The countries with monetary autonomy seem to have fared better in recent years if Central Banks eased aggressively enough to offset the various headwinds the global economy has been facing for a decade now. Being able to depreciate their currencies was also helpful as means to restore full employment. Countries pegged to the euro or eurozone countries, on the other hand, did not have the same advantage. Furthermore, the ECB’s monetary policy was highly contractionary during the first years after the financial crisis, which had significant negative effects on the economic performance for the Eurozone as a whole with some countries being more adversely affected than others.
In what follows, I compare the macroeconomic outcomes for Northern European countries mentioned in the beginning of the post (Scandinavia, the Baltics, and Iceland).
In the next three graphs I have plotted real GDP for the countries under consideration. I have grouped them together as follows: Denmark and Finland (the first one being part of the European Exchange Rate Mechanism and the other one being a Eurozone country), the three Baltics, and the three countries with flexible exchange rates. I have also always included a series that plots the average real GDP for the group of OECD countries.
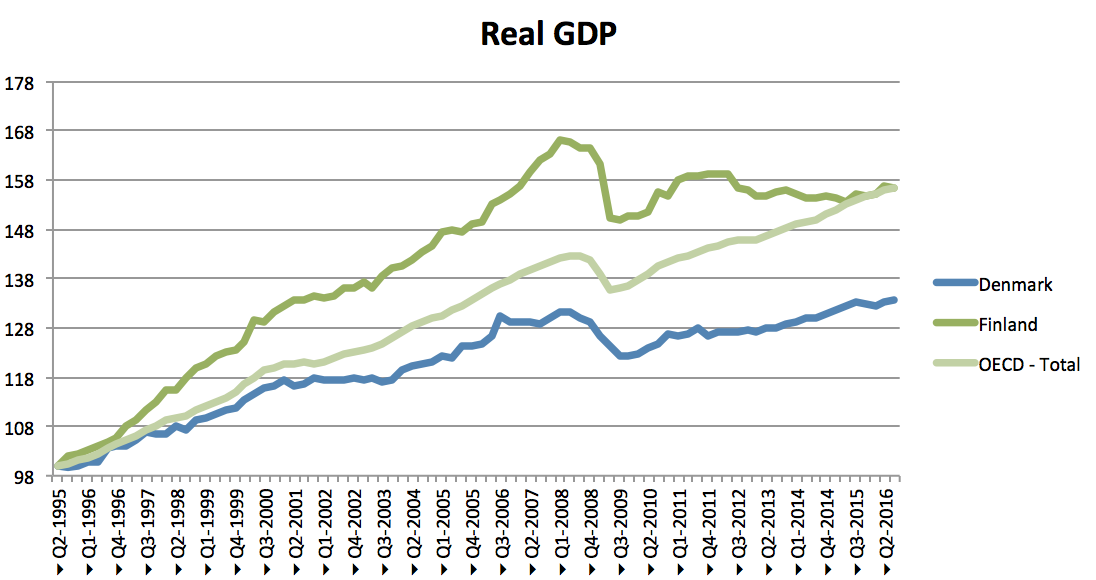
The figures reveal some interesting facts:
1)The Baltics have experienced extremely rapid GDP growth before the crisis. This is not very surprising. Their economies were still relatively poor, which means that there was substantial room for catch-up growth. They also benefited a great deal from the entry into the common market of the EU. Nevertheless, as of 2007 the real per capita income of the Baltics was only in the range of 25 to 30% compared to high income countries like Finland or Denmark, and that was after a period of significant catch-up growth.
2) The Baltics also experienced the most severe economic contraction, ranging from more than 16% for Lithuania to about 22% for Estonia. Furthermore, real GDP is still below the 2008 level in Latvia and Estonia whereas it is slightly above the 2008 level in Lithuania. As a comparison, OECD countries have experienced an average increase in GDP by about 10% in between 2008 and 2016.
3) While Finland has experienced signficantly faster GDP growth before the crisis compared to the OECD average, its real GDP in 2016 is still several percentage points below its peak level in 2008. The country has thus experienced more than a decade of stagnation now.
4) Denmark experienced slower than OECD-average GDP growth already in the runup to the global financial crisis. The problem of slow growth has exacerbated since 2008. Similar to Finland, Denmark has seen almost a decade of economic stangation and real GDP is just a couple of percentage points higher than in 2008.
5) Iceland experienced rapid GDP growth in the beginning of the 2000s. Part of it was probably the result of increasing financialization as its financial sector managed bank deposits worth more than 2.5 times the country's GDP. The country experienced a severe slump after 2008 as a result of the financial crisis. However, it managed to stage an economic recovery after 2011. The large depreciation of the Icelandic Krona in addition to the implementation of capital controls in order to prevent capital outflows were two key policies that helped the country to recover from the significant economic slump in the aftermath of the financial shock.
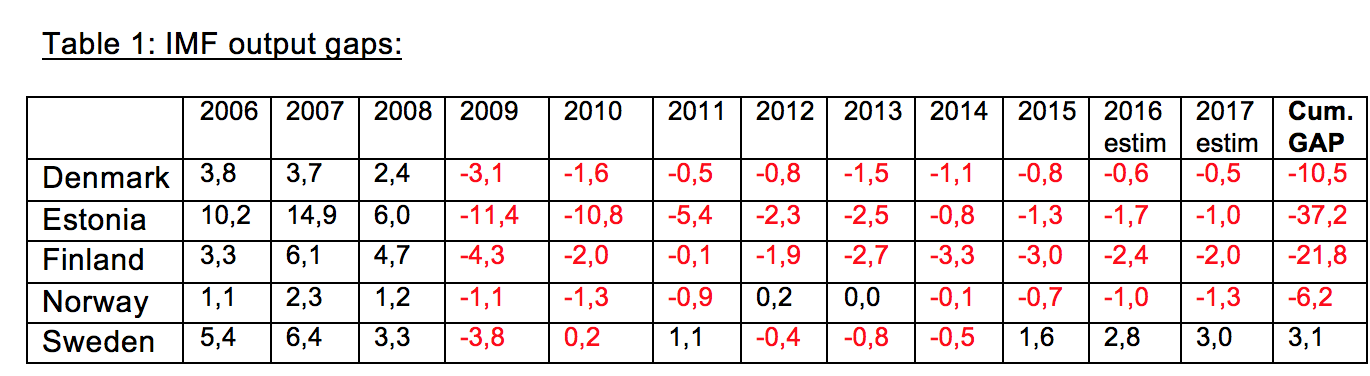
The IMF has estimated annual output gaps for 5 of the countries summarized in the table below. One can see that Estonia had a significant output gap in excess of 10% in 2009 and 2010. Furthermore, there is reason to believe that this actually understates the true output gap. That is because of the methodology the IMF has used. The data shows that IMF economists believe that Estonia had a positive output gap of about 15% in 2007, meaning that the economy produced 15% above potential. This figure seems highly implausible. While inflation was in excess of 6% and inflationary pressures were building up, this simply implies that the economy was operating at full capacity and that supply constraints were starting to bind. While the estimates show that every country was operating above potential before the financial crisis, it is extremely problematic to assume large positive output gaps. I have also calculated the cumulative output gap since the 2008. Once again we can see that Estonia stands out with a cumulative output gap after the crisis of close to 40% of GDP, followed by Finland with more than 20% and Denmark with more than 10%. Again, the EMU countries (including Denmark) stand out as having an extraordinary bad economic performance while the free-floating countries Norway, and Sweden in particular, have fared much better. Notice that according to the IMF Sweden has been operating above potential in recent years, a somewhat dubious assumption given that inflation has been persistently below 2%. Finally, notice that as of 2016 the negative output gaps for the country in question have mostly closed. This is bad news insofar as it implies that the persistent economic slump after 2008 had a negative effect on long-run economic potential, which has been consistently revised downwards in recent years as economic growth failed to pick up.
1)The Baltics have experienced extremely rapid GDP growth before the crisis. This is not very surprising. Their economies were still relatively poor, which means that there was substantial room for catch-up growth. They also benefited a great deal from the entry into the common market of the EU. Nevertheless, as of 2007 the real per capita income of the Baltics was only in the range of 25 to 30% compared to high income countries like Finland or Denmark, and that was after a period of significant catch-up growth.
2) The Baltics also experienced the most severe economic contraction, ranging from more than 16% for Lithuania to about 22% for Estonia. Furthermore, real GDP is still below the 2008 level in Latvia and Estonia whereas it is slightly above the 2008 level in Lithuania. As a comparison, OECD countries have experienced an average increase in GDP by about 10% in between 2008 and 2016.
3) While Finland has experienced signficantly faster GDP growth before the crisis compared to the OECD average, its real GDP in 2016 is still several percentage points below its peak level in 2008. The country has thus experienced more than a decade of stagnation now.
4) Denmark experienced slower than OECD-average GDP growth already in the runup to the global financial crisis. The problem of slow growth has exacerbated since 2008. Similar to Finland, Denmark has seen almost a decade of economic stangation and real GDP is just a couple of percentage points higher than in 2008.
5) Iceland experienced rapid GDP growth in the beginning of the 2000s. Part of it was probably the result of increasing financialization as its financial sector managed bank deposits worth more than 2.5 times the country's GDP. The country experienced a severe slump after 2008 as a result of the financial crisis. However, it managed to stage an economic recovery after 2011. The large depreciation of the Icelandic Krona in addition to the implementation of capital controls in order to prevent capital outflows were two key policies that helped the country to recover from the significant economic slump in the aftermath of the financial shock.
The IMF has estimated annual output gaps for 5 of the countries summarized in the table below. One can see that Estonia had a significant output gap in excess of 10% in 2009 and 2010. Furthermore, there is reason to believe that this actually understates the true output gap. That is because of the methodology the IMF has used. The data shows that IMF economists believe that Estonia had a positive output gap of about 15% in 2007, meaning that the economy produced 15% above potential. This figure seems highly implausible. While inflation was in excess of 6% and inflationary pressures were building up, this simply implies that the economy was operating at full capacity and that supply constraints were starting to bind. While the estimates show that every country was operating above potential before the financial crisis, it is extremely problematic to assume large positive output gaps. I have also calculated the cumulative output gap since the 2008. Once again we can see that Estonia stands out with a cumulative output gap after the crisis of close to 40% of GDP, followed by Finland with more than 20% and Denmark with more than 10%. Again, the EMU countries (including Denmark) stand out as having an extraordinary bad economic performance while the free-floating countries Norway, and Sweden in particular, have fared much better. Notice that according to the IMF Sweden has been operating above potential in recent years, a somewhat dubious assumption given that inflation has been persistently below 2%. Finally, notice that as of 2016 the negative output gaps for the country in question have mostly closed. This is bad news insofar as it implies that the persistent economic slump after 2008 had a negative effect on long-run economic potential, which has been consistently revised downwards in recent years as economic growth failed to pick up.
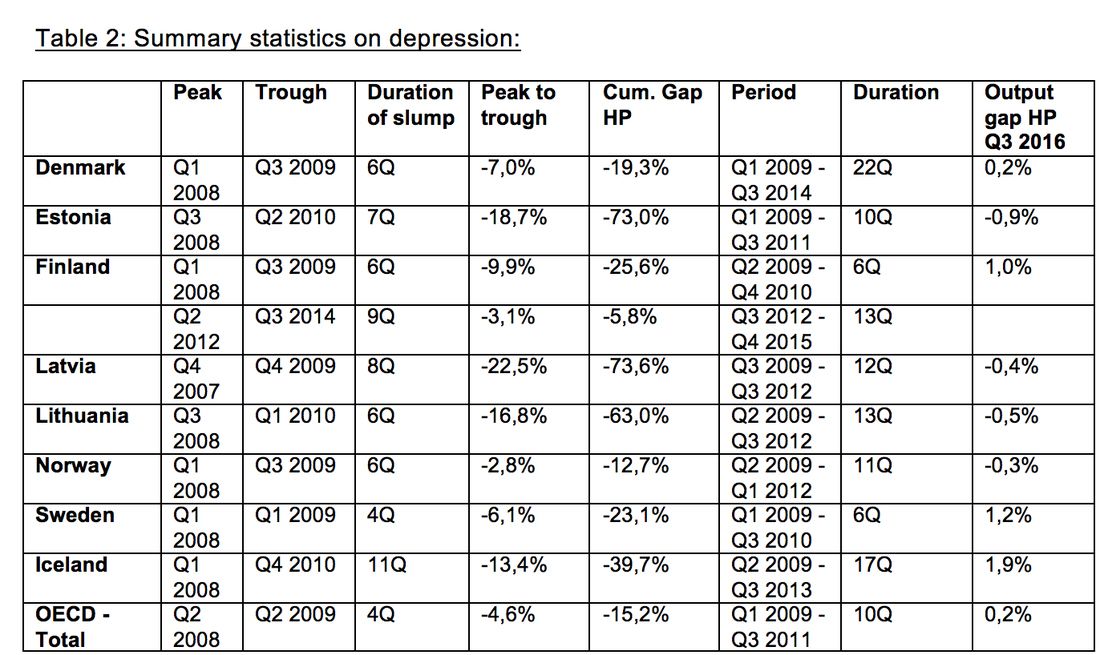
Using the well-known Hodrick-Prescott filter to determine trend GDP, I calculated output gaps for all Nordic countries using quarterly data. The table below summarizes my findings as well as some key statistics on the length and severity of the economic contraction. The Baltics experienced the largest contraction with equal to 17%, 19%, and 23% of GDP for Lithuania, Latvia and Estonia, respectively. With the exception of Iceland and Finland, the Baltics also experienced the longest contraction measured from peak to trough. Finland experienced one slump that lasted 6 quarters starting in the first quarter of 2008. It then experienced a second contraction lasting a full 9 quarters starting in the second quarter of 2012.
The economic contraction is even longer when measured in quarters where the economy experienced negative output gaps. Here Denmark stands out as being a particularly bad performer with 22 consecutive quarters of negative output gaps and a cumulative negative output gap of 19% of GDP. While the contraction measured in this way was not as long in the Baltics, the severity was much more pronounced with cumulative negative output gaps of more than 60% in Lithuania and more than 70% in both Latvia and Estonia.
All countries other than Norway experienced more severe contractions than the OECD average. This might be due to the fact that small and open economies suffered a lot from the significant decline in global trade that occurred after 2008. Notice how as of 2016 output gaps as measured by the Hodrick-Prescott filter have mostly closed, not so much because growth has accelerated but rather because potential output has been revised downward in the aftermath of the recession.
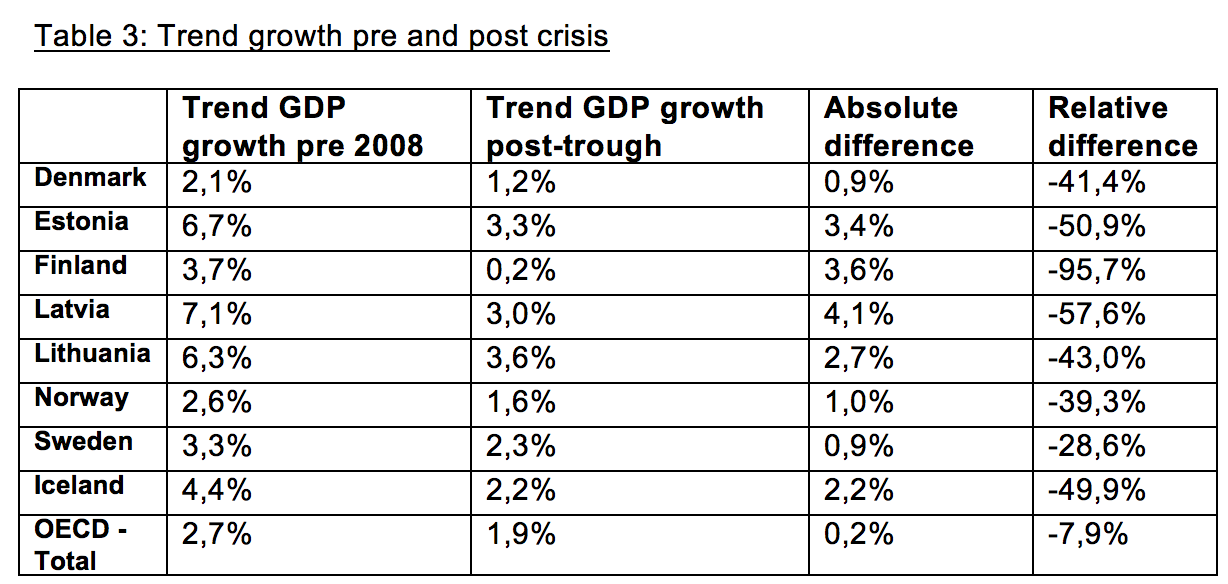
Finally, the following table shows a comparison of trend growth rates before and after the Great Recession. The Baltics experienced significant catch-up growth in the late 90s and early 2000s with growth rates well above 6%. The acceptance into the common market was a big deal and allowed to growth to speed up as the Baltics became more integrated into the economy of the European Union. However, trend GDP growth has declined significantly in the aftermath of the financial crisis. A slowdown was to expected as the Baltics became richer and converged towards Western European GDP per capita levels. However, a more than 50% decrease in trend GDP within a few years is unprecedented. It seems very likely that the severe and long economic depression cast a shadow on future growth rates by permanently increasing unemployment rates as well as by depressing investments. Furthermore, given their relative low levels of real GDP per capita compared to the other Nordic economies, the Baltics should still have substantial room for catch-up growth.
Finland suffered the most significant slowdown from a pre-crisis trend growth rate of above 4% to a post-crisis trend growth rate that is close to zero. Denmark's trend growth rate also more than halved compared to the period before the crisis. Furthermore, both Denmark and Finland have post-crisis trend growth rates far below OECD average.
Meanwhile, the countries with flexible exchange rates Iceland, Norway, and Sweden also experienced small declines in the trend growth rates, but to a much smaller extent than the countries on the euro standard. Both Sweden and Iceland had extremely high pre-crisis trend growth rates given their level of per capita income. So the slowdown after 2008 just represents a convergence towards the OECD average.
We can thus see that in terms of long-run growth potential the countries on the Euro standard seem to be at a significant disadvantage. The Great Depression was solved by the termination of the gold standard. Countries that abandoned the peg to gold early and let their exchange rate float were able to implement more accommodative monetary policies, which ended the depression, while countries that remained on gold suffered from a years of economic hardship until the gold standard was dissolved. Unfortunately, the euro is here to stay. Some Euro countries are now experiencing a decade of stagnation with no end in sight. The following decade might give us an answer to the question whether being part of a suboptimal currency union can have long-run detrimental effects on macroeconomic outcomes. For the millions of people who have been unemployed for many years now as a result of the crisis the long-run has certainly already come.
All of this is very worrying because in contrast to the gold standard you cannot simply abandon the euro because it would trigger the mother of all financial crises. We will know more in the years to come, but I'm certainly agreeing with Dornbusch and other Anglo-Saxon economists that when it comes to bad economic ideas the Euro is definitely very high up on the list.
All of this is very worrying because in contrast to the gold standard you cannot simply abandon the euro because it would trigger the mother of all financial crises. We will know more in the years to come, but I'm certainly agreeing with Dornbusch and other Anglo-Saxon economists that when it comes to bad economic ideas the Euro is definitely very high up on the list.

 RSS Feed
