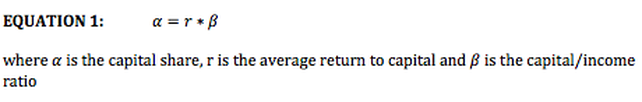
In my previous post I have extensively written about what Piketty calls the first fundamental law of capitalism. His so-called law simply states that the capital share of income alpha is equal to the average return to capital r times the capital/income ratio beta. Mathematically, we have the following equation:
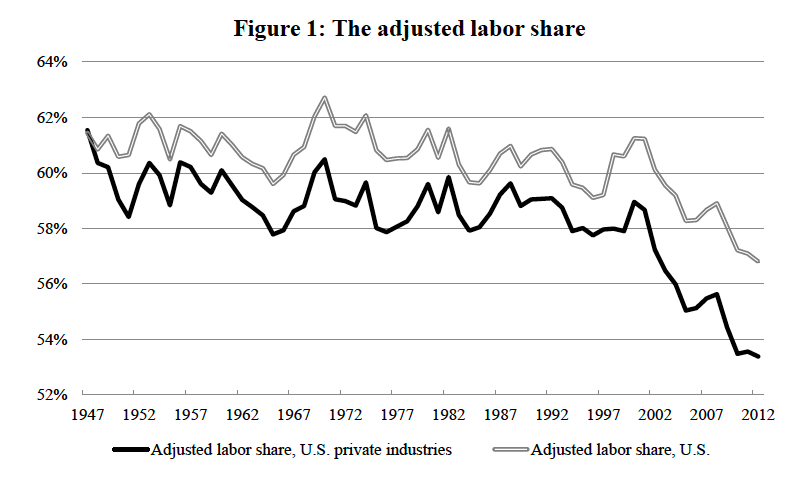
One should note that this is a simple accounting identity, which must be true at all times. As I have explained previously, Piketty has extensively documented that the capital share of income in industrialized countries has increased quite significantly and he also projects that this trend is likely to continue. The reason for the increase in the capital share is, of course, that capital/income ratios have risen quite substantially. As I have explained last time, an elasticity of substitution between capital and labor larger than 1 implies that the return to capital does not decrease substantially as more capital gets accumulated. As a consequence, an increase in beta combined with only small decrease in r implies a larger capital share of income, as pure matter of accounting (see equation 1).
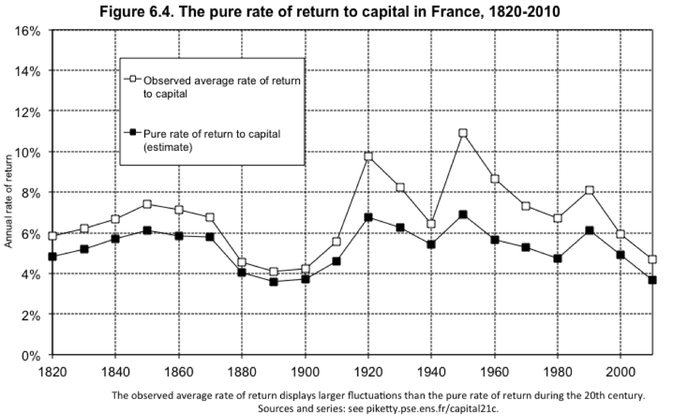
To understand the changes in the capital share of income, one thus has to understand the dynamics behind the capital/income ratio and the return to capital. It turns out that the average return to capital has remained relatively stable over time. More specifically, Piketty estimated the pure rate of return for France, which is simply the average return minus the cost of portfolio management (i.e. the value of time spent managing one’s wealth). The first thing to note is that the pure return on capital is roughly one to two percentage points smaller than the average return. Piketty notes that his estimates should probably regarded as minimum values on the return to capital, which is a pretax return.
The second thing to note is that historically the return on capital has mainly fluctuated within a relatively narrow band of 4 to 6%. In accordance with the law of diminishing returns, the return to capital was somewhat lower at about 4% when the capital/income ratio in France was very high at roughly 700% around 1900. Remember that a capital/income ratio of 700% means that the total market value of wealth within the economy is equal to seven years of national income (GDP).
A much higher return on capital of more than 6% can be observed in the 1950s when the capital/income ratio was at its historical low of only 300%. In recent decades, the capital/income ratio has increased significantly again, exceeding 600% in the early 2000s and thus slowly returning to its historical high that one could observe in the late 19th and early 20th century. The graph below shows that the pure rate of return to capital estimated by Piketty has only decreased somewhat (from 5% in the 1980s to 4% nowadays) as the capital/income ration increased quite significantly (from about 400% to now 600% over the same time period). This seems to confirm Piketty’s claim that the elasticity of substitution between capital and labor is relatively high (larger than one), meaning that labor is quite easily replaceable by capital. This would mean that the average return to capital decreases slowly even as more capital is accumulated since additional units of capital remain quite productive.
The graph below tracks the historical capital/income ratio in France from 1700 until today. One can see that this ratio has historically been very high and constant at around 700% for more than two centuries. The total market value of capital fell then rapidly in the beginning of the 19th century, hitting a historical low of less than 300% in the 1950s. Subsequently, the capital/income ratio recovered and increased over a significant period of time to exceed 600% for the first time again in the early 2000s. Piketty projects that this increase is likely to continue and that we might observe a return to the historical norm of the 18th and 19th century in which the capital/income ratio was at about 700%.
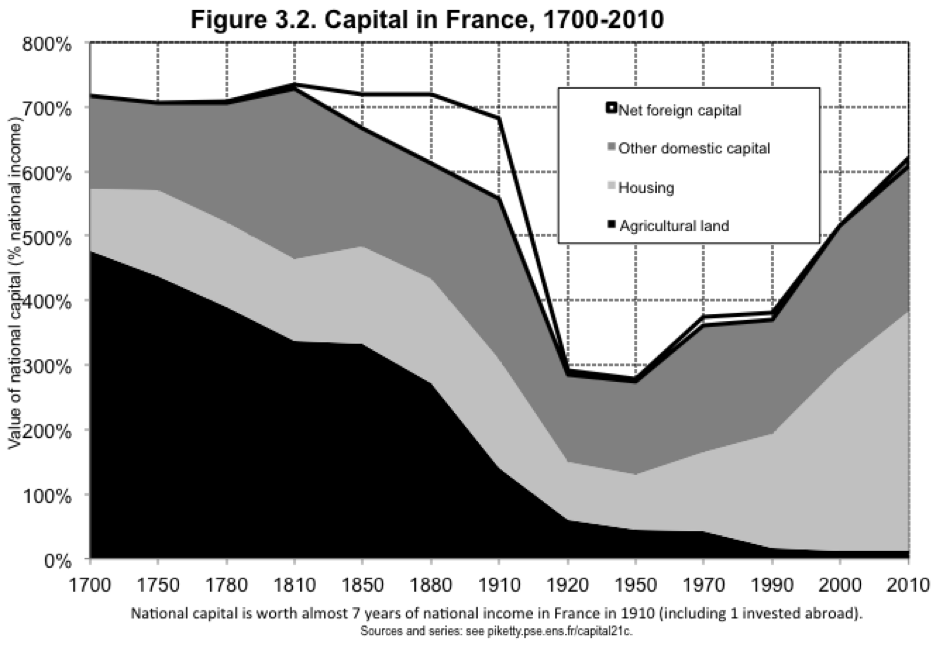
The figure above also shows that the nature of capital has changed quite dramatically over the last centuries. In the 18th century, agricultural land was still very important and accounted for more than 400% of national wealth around 1700. This value decreased significantly over the course of the last centuries. Agricultural land has been marginalized and only accounts for a tiny fraction of wealth nowadays. Similarly, net foreign capital played a much more dominant role around 1900 when France, as a colonial power, still owned a lot of assets abroad. Net foreign capital has also been marginalized. Nowadays French do not own much more assets abroad than what foreigners own in France, meaning that the net foreign asset position of France is close to zero. The most fundamental transformation has occurred in housing where the value increased from less than one year of national income to about four years of national income in 2010.
According to Piketty, the fundamental change in the asset structure reflects the fact that over the last centuries agricultural land has been replaced by buildings, business capital and financial capital invested in firms or governmental organizations. The substantial increase in housing can be explained by a size and quality effect, i.e. people developed a taste for larger and higher quality residences over the last centuries. Furthermore, since the Industrial Revolution there has been an enormous accumulation of buildings used for business purposes, infrastructure, machinery, warehouses, offices, tools, etc., all of which is used by firms and governments to produce all sorts of goods and services.
The nature of capital has thus changed quite fundamentally while the size of the capital stock (relative to one year’s income) has returned in recent years to the level one could observe in the 19th and 18th century.
It is interesting to note that the U-shaped curve of the capital/income ratio, a rapid decline in the beginning of the 20th century followed by a return to higher levels over the subsequent decades, is not specific to France. One can observe in basically all industrialized countries this U-shaped pattern. The reason being, of course, that the world economy was subject to three enormous shocks in the beginning of the 20th century, which followed each other in rapid succession: World War I, followed by the Great Depression, followed by World War II.
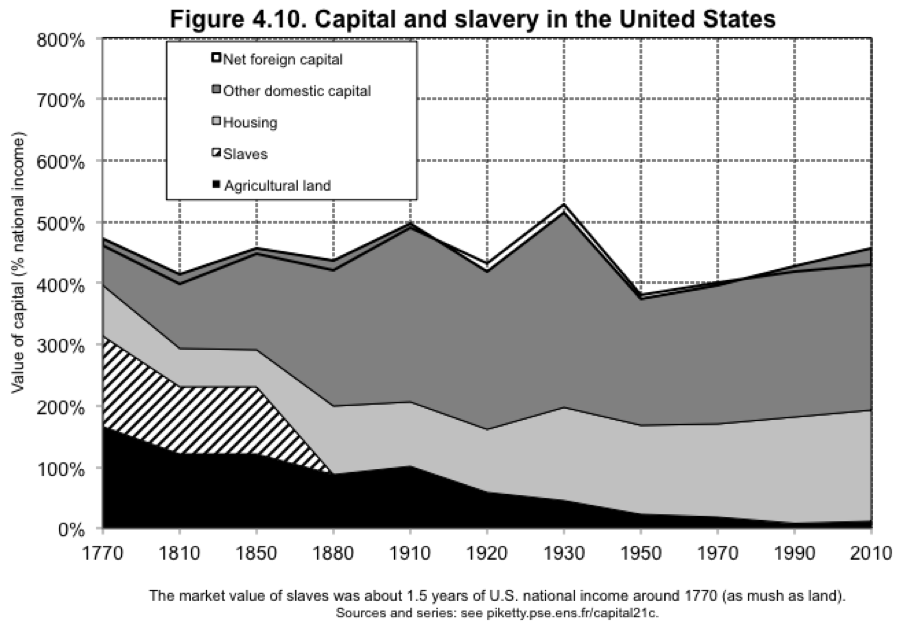
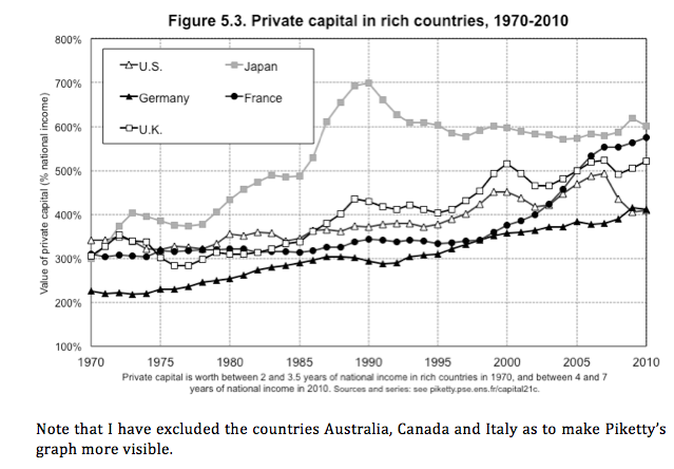
The two World Wars not only led to the annihilation of millions of lives, but also led to an enormous destruction of the capital stock of the nations that were involved in the conflict. Obviously, continental Europe was the most affected by both World Wars, meaning that the capital stock in continental European countries reached a record low of 300% or less. This is true even for Britain even though destruction due to war was considerably lower on the British Isles than on the continent. This is obviously even more true for North America where no war act of war took place, at least on the continent. Nevertheless, the U-shaped pattern of the capital/income ratio can also be observed for the U.S. and Canada, even though to a much lesser degree than in Europe. The reason being that the Great Depression also led to a considerable destruction of capital as many firms and enterprises were forced to go out of business because of a substantial lack of aggregate demand, especially in the countries that stayed on the gold standard until its demise.
Like all industrialized countries in Europe, Canada and the U.S. were also very strongly affected by the Great Depression, a global economic downturn that basically was the result of inadequate demand. With the implementation of counterproductive policies (the erection of trade barriers, the initiation of austerity), the depression went on for many years. Some countries decided to leave the gold standard early on as to be able to pursue expansionary monetary policy. As a consequence, they recovered rather quickly from the crisis and full employment was restored while other countries suffered from years of depression as they failed to stabilize aggregate demand because they were tied by the peg to gold. As the economic crisis lasted many years in the U.S., a lot of capital was destroyed as firms and enterprises went under. The Great Depression thus also led to a decrease in the capital/income ratio in North America (see the U.S. case below), though it was much less pronounced than in Europe.
According to Piketty, the fundamental change in the asset structure reflects the fact that over the last centuries agricultural land has been replaced by buildings, business capital and financial capital invested in firms or governmental organizations. The substantial increase in housing can be explained by a size and quality effect, i.e. people developed a taste for larger and higher quality residences over the last centuries. Furthermore, since the Industrial Revolution there has been an enormous accumulation of buildings used for business purposes, infrastructure, machinery, warehouses, offices, tools, etc., all of which is used by firms and governments to produce all sorts of goods and services.
The nature of capital has thus changed quite fundamentally while the size of the capital stock (relative to one year’s income) has returned in recent years to the level one could observe in the 19th and 18th century.
It is interesting to note that the U-shaped curve of the capital/income ratio, a rapid decline in the beginning of the 20th century followed by a return to higher levels over the subsequent decades, is not specific to France. One can observe in basically all industrialized countries this U-shaped pattern. The reason being, of course, that the world economy was subject to three enormous shocks in the beginning of the 20th century, which followed each other in rapid succession: World War I, followed by the Great Depression, followed by World War II.
The two World Wars not only led to the annihilation of millions of lives, but also led to an enormous destruction of the capital stock of the nations that were involved in the conflict. Obviously, continental Europe was the most affected by both World Wars, meaning that the capital stock in continental European countries reached a record low of 300% or less. This is true even for Britain even though destruction due to war was considerably lower on the British Isles than on the continent. This is obviously even more true for North America where no war act of war took place, at least on the continent. Nevertheless, the U-shaped pattern of the capital/income ratio can also be observed for the U.S. and Canada, even though to a much lesser degree than in Europe. The reason being that the Great Depression also led to a considerable destruction of capital as many firms and enterprises were forced to go out of business because of a substantial lack of aggregate demand, especially in the countries that stayed on the gold standard until its demise.
Like all industrialized countries in Europe, Canada and the U.S. were also very strongly affected by the Great Depression, a global economic downturn that basically was the result of inadequate demand. With the implementation of counterproductive policies (the erection of trade barriers, the initiation of austerity), the depression went on for many years. Some countries decided to leave the gold standard early on as to be able to pursue expansionary monetary policy. As a consequence, they recovered rather quickly from the crisis and full employment was restored while other countries suffered from years of depression as they failed to stabilize aggregate demand because they were tied by the peg to gold. As the economic crisis lasted many years in the U.S., a lot of capital was destroyed as firms and enterprises went under. The Great Depression thus also led to a decrease in the capital/income ratio in North America (see the U.S. case below), though it was much less pronounced than in Europe.
According to Piketty, the record-low capital/income shares one could observe in the 1950s in industrialized countries were the result of three unique enormous shocks that hit the world economy in the previous decades: the two World Wars and the Great Depression. Since the 1950s, capital/income rations have mostly recovered and Piketty projects that they will rise even further, thus reaching soon the historical norm of about 700% one could observe in countries like France and Britain in the 18th and 19th century.
Piketty’s second fundamental law of capitalism
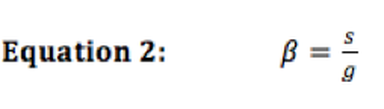
Contrary to what Piketty calls the first fundamental law of capitalism (see above), the second law is not a simple accounting identity. From basic growth theory, one can derive the fundamental forces that determine the capital/income ratio in the long-run. Specifically, the capital/income ratio beta is equal to the ratio of the economy’s saving rate s over the economy’s growth rate g.
Piketty’s second fundamental law of capitalism
Contrary to what Piketty calls the first fundamental law of capitalism (see above), the second law is not a simple accounting identity. From basic growth theory, one can derive the fundamental forces that determine the capital/income ratio in the long-run. Specifically, the capital/income ratio beta is equal to the ratio of the economy’s saving rate s over the economy’s growth rate g.
It is important to note that this identity does not hold at all times, but is only correct in the long-run. It might take years or even decades for the capital/income ratio to converge to the ratio of the savings rate over the growth rate of the economy.
This second law is much more easily understood if one looks at a hypothetical example. Let’s assume an economy with an annual savings rate of 12% and an annual growth rate of GDP of 2%. This economy will then end up with a capital/income ratio of 6 (12%/2%=6). Consider first the equilibrium case in which the economy already starts with a capital/income ratio of 6. The total capital stock might be 600 and total income might be 100. With a savings rate of 12%, 12 units of capital are added, leading to a capital stock of 612. This means that capital has grown at a rate of 2% (612/600=1.02). But since income also grows at a rate of 2%, total income will increase to 102. This, of course, means that the capital/income ratio is still 6 (612/102=6). So in this hypothetical scenario with a savings rate of 12% and growth rate of 2%, the capital/income ratio always remains at 6.
So now with the same savings and growth rate, a lower capital/income ratio than 6 implies that the capital stock will grow faster than income. In that case the capital/income ratio will increase until it converges to 6 where it will remain indefinitely. Conversely, a larger capital/income ratio than 6 implies that the capital stock grows slower than income, meaning that the capital/income ratio will fall until it reaches 6 again.
One should, however, be aware of the fact that this process of convergence to the ratio s over g can take up many years or even decades. Piketty notes that the capital/income ratio in many industrialized countries has not yet recovered from the shocks of the early 20th century and he projects a further increase to the levels of around 700% one has seen in the previous centuries.
This logic becomes clear if one considers the behavior of savings and growth rates. First, one should be aware of the fact that there are two components to an economy’s growth rate: Real GDP growth is equal to the sum of growth in total factor productivity (productivity gains) and the population growth rate. Obviously, only gains in productivity improve the standard of living while population growth increases the size of the entire economy, but does not improve per capita income.
The table below shows per capita growth, population growth and real GDP growth (the sum of the two) for the world, Western Europe and North America for selected time periods, including predictions for the decades to come.
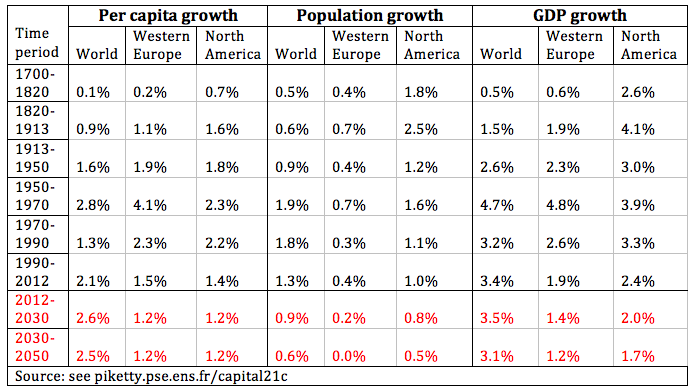
There is obviously a high degree of uncertainty around some of these predictions. In particular, it is close to impossible to forecast productivity gains. Nobody can predict when the next major innovation will be invented, what it will be, and more importantly, what effect it will have on future growth rates. The table shows that the pace of innovation was somewhat faster in the years after World War II, but slowed down subsequently: the country at the world technological frontier, the U.S., grew in per capita terms more than 2% from the 1950s to the 1990s, but only at about 1.4% from 1990 to 2012. This slowdown partly reflects lower productivity growth in the aftermath of the financial crisis of 2007. However, this effect is likely to be temporary. Productivity gains in the U.S. already slowed down substantially in the 1970s, but recovered subsequently as major innovations in IT occurred in the early 90s. A priori, there is no fundamental reason to believe why innovation should stall in the decades to come. Piketty’s projection that the world technological frontier will grow at 1.2%, slightly lower than before, is relatively realistic. However, it also could be that productivity gains will average more than 2% as major innovation occur, or that growth might actually slowdown significantly because future innovations just do not contribute very much to productivity gains. There is just no way to know for sure, but the ‘central scenario’ in which productivity roughly growth at the same rate as in the two previous decades seems to be the most likely.
One should also note that European growth rates were much higher than U.S. growth rates from 1950 to 1970. That is, of course, because Europe experienced rapid ‘catch-up growth’ during that period as the continent was in the process of reconstruction after World War II. Growth rates obviously converged to the ones observed in the U.S. as Europe approached the technological frontier.
There is a higher degree of certainty about the future of population growth rates. European population growth rates are likely to be close to 0 in the decades to come, which is actually already the case in some countries such as Germany. Because of the slowdown in the population growth component, total real GDP growth will likely fall from about 2% now to maybe 1.4% in the decades to come (with population growth close to 0, total GDP growth just equals the gains in productivity).
Now, this will mean that for a given savings rate of 12%, for example, a slowdown in GDP growth rate from 2% to 1.5% implies an increase in the capital/income ratio from 6 (12/2) to 8. This is exactly the scenario that Piketty projects: An increase in the capital/income ratio to about 800%, which implies a return to the historical norm of the 18th and 19th century.
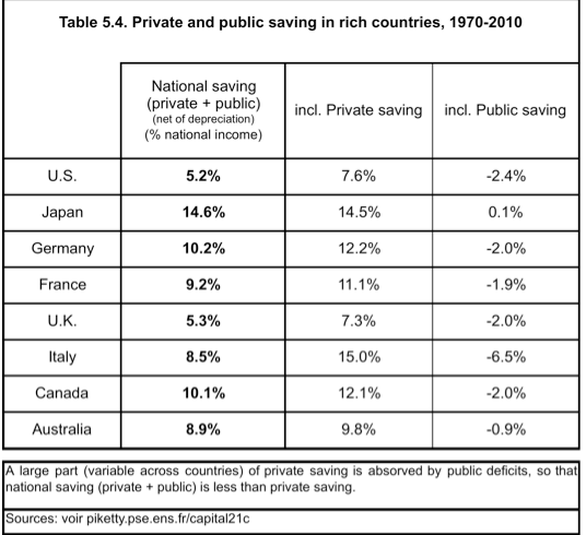
Now, one should note that a saving s rate of 12% is relatively high (see table above). Many industrialized countries have a net savings rate (net of depreciation) below 10%. One should note though that the countries ageing the fastest (Germany and Japan) have substantially higher savings rates. This, of course, could also be due to cultural differences. However, it is also plausible to assume that ageing populations save more since a larger proportion of the population already has to put back funds for retirement.
One can thus speculate that savings rates in other industrialized countries are also going to reach n the near future the levels one can observe nowadays in Germany and Japan as their populations are ageing as well. All else equal, such an increase in s will then lead to a higher capital/income ratio in the long-run (see equation 2). However, it is far from certain that such an increase in the savings rate will actually occur. Nevertheless, it Is very likely that one will still observe increasing capital/income ratio because of the slowdown of real growth rates. As mentioned above, for a given savings rate, a decrease in the growth rate implies a higher capital/income ratio in the long-run. The slowdown in g forecasted by Piketty will almost certainly occur because the population component in the real growth rate will fall steadily in the next decades.
For the reasons mentioned above, capital/income ratios have already recovered from the record-low values one could observe in the 1950s. The economic mechanisms I just described will likely lead to a further increase in the capital/income ratio in the decades to come, potentially to the high value of around 800% one could observe in Britain and France around 1900 and before, which will likely lead to higher levels of inequality since capital is highly concentrated within society.
I will write more about rising inequality next time. This will be it for now. To be continued...

 RSS Feed
