As far as I can tell, the most common narrative about the recent stock market crash is about rising inflation and rising wages. However, I think this is pretty wrong! Bloomberg, the Financial Times, etc. will have us believe that the U.S. stock market lost about 10% of its value, and taking global stock markets down with it, because after almost a decade of "lowflation" we finally see some convincing evidence that wages and prices are rising at a somewhat more rapid pace than previously. Well, let's have a look at the data.
Below we can see the 5-year breakeven inflation rate. This is basically financial markets' forecast of the average inflation rate over the next 5 years, implied by the difference between normal 5-year U.S. government bonds and inflation-protected U.S. government securities of the same maturity.
Below we can see the 5-year breakeven inflation rate. This is basically financial markets' forecast of the average inflation rate over the next 5 years, implied by the difference between normal 5-year U.S. government bonds and inflation-protected U.S. government securities of the same maturity.
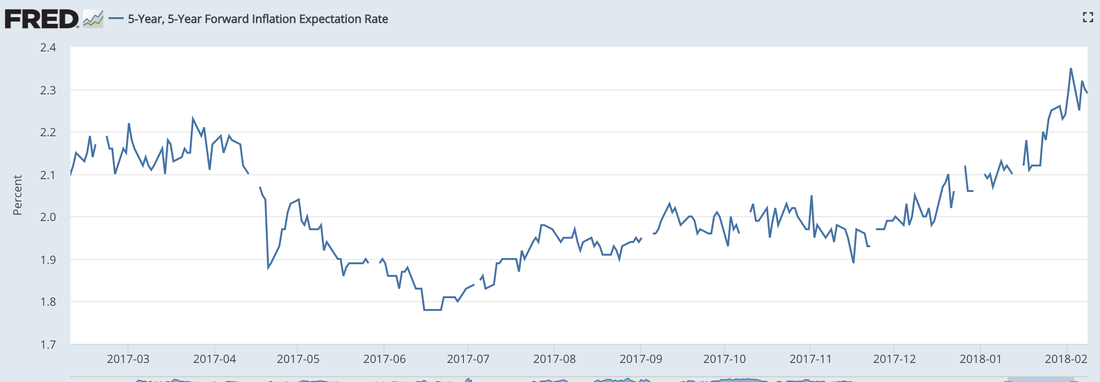
One can see that financial markets revised their estimate of the future inflation rate. However, the increase is relatively minor as the implied inflation rate went up by a little more than 20 basis points over the last couple of months. This is not nothing but it definitely is a very far cry from the inflationary outburst that some people have predicted over and over again. Note that even now financial markets actually do not expect the Fed to hit its 2% inflation target since the spread is indicating that CPI will be just above 2% within the next 5 years while the Fed is actually targeting the PCE (personal consumption expenditure), which usually runs about 30 to 50 basis points below the CPI. While the chart above shows that financial markets somewhat recoded their forecast of future inflation, this minor increase cannot account for the 10% drop in US stock markets over the last few weeks which wiped out some 2 trillion dollars in wealth from US equities.
Another very popular story is that the recent increase in nominal wages soenjow led to the stock market crash. I find that story quite unbelievable as well I must say. The chart below depicts the yearly change in nominal wages. For the first time since the financial crisis yearly wages are now changing at a rate of close to 3%, compared to just about 2.5% just a few month ago.
Another very popular story is that the recent increase in nominal wages soenjow led to the stock market crash. I find that story quite unbelievable as well I must say. The chart below depicts the yearly change in nominal wages. For the first time since the financial crisis yearly wages are now changing at a rate of close to 3%, compared to just about 2.5% just a few month ago.
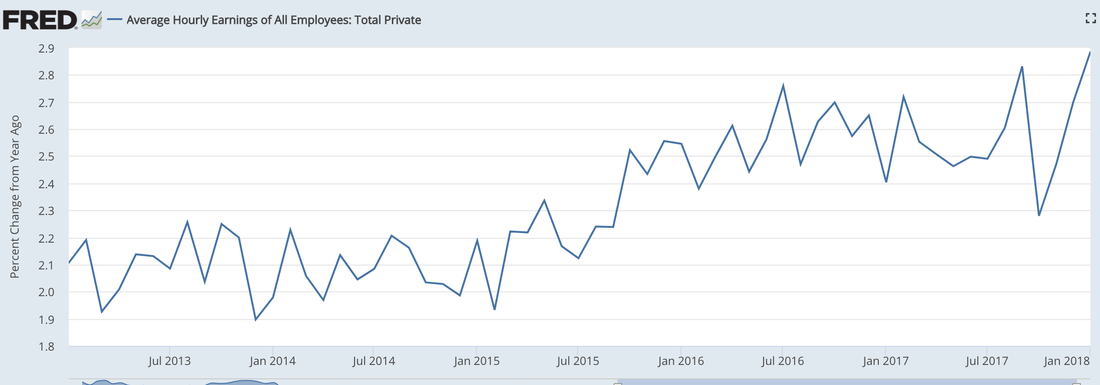
Again, this seems to be a relatively minor upward trend. Given that US businesses just got a trillion dollar tax cut thanks to Trump, I find it hard to believe that some additional pressure in the labor market in the form of higher nominal wages is squeezing corporate markups to such an extent that it leads to a huge market sell off and 10% decline in the stock market.
Here is what I think happened over the last couple of weeks. The stock market has experienced an unprecedented boom since the Trump election. Actual gains over the last year amounted to about 5 trillion US dollars, meaning that the recent sell off only wiped out a portion of the wealth that was created. While it was not really a bubble, US stock markets had reached extremely high valuations from an historical point of view as measured by the PE ratio (price-earnings).
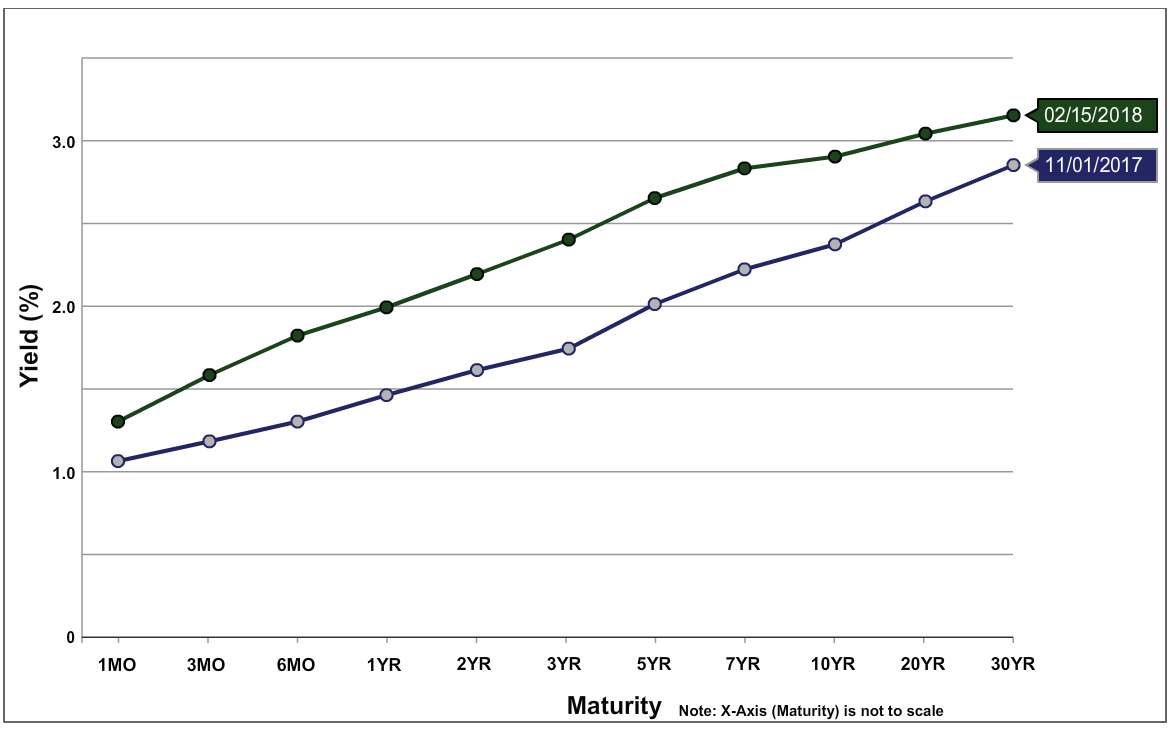
Economic fundamentals still look strong and most forecasts estimate that the first quarterly GDP figures in 2018 will come in relatively high, likely in excess of 3%. If contained, the recent market sell off will have a very muted effect on investment and consumption and can thus be compared to the 1987 stock market crash, which barely affected the economy at all. In that sense, what happened is that financial markets adjusted over the last few weeks to a new equilibrium with somewhat lower stock market valuations and higher bond yields. Note that the entire yield curve has shifted up by about 50 basis points from last November.
Economic fundamentals still look strong and most forecasts estimate that the first quarterly GDP figures in 2018 will come in relatively high, likely in excess of 3%. If contained, the recent market sell off will have a very muted effect on investment and consumption and can thus be compared to the 1987 stock market crash, which barely affected the economy at all. In that sense, what happened is that financial markets adjusted over the last few weeks to a new equilibrium with somewhat lower stock market valuations and higher bond yields. Note that the entire yield curve has shifted up by about 50 basis points from last November.
Treasury yield curve, last November compared to today
Financial markets still expect the Fed to go through with an anticipated three rate hikes by the end of the year. However, with Powell just being elected as the new chairman, we do not ah e a great sense of how the Fed's new reaction function looks like, thus casting a little bit of doubt on this forecast.
One last piece of advice, please follow Scott Sumner's motto and avoid reasoning from a price change! There was a lot of talk recently about how higher yields would lead to a decline in stock markets. Ironically, now people assert that higher yields might actually lead to a rise in stock market prices, which is historically actually more accurate. Higher nominal yields can be the result of an increase in inflation expectations and/or higher growth expectations, which both would be good news for stocks. Regardless, prices can change either as a result of a shift in demand or a shift in supply. You need to know which one it is if you want to avoid making nonsensical statements!
One last piece of advice, please follow Scott Sumner's motto and avoid reasoning from a price change! There was a lot of talk recently about how higher yields would lead to a decline in stock markets. Ironically, now people assert that higher yields might actually lead to a rise in stock market prices, which is historically actually more accurate. Higher nominal yields can be the result of an increase in inflation expectations and/or higher growth expectations, which both would be good news for stocks. Regardless, prices can change either as a result of a shift in demand or a shift in supply. You need to know which one it is if you want to avoid making nonsensical statements!

 RSS Feed
