Just a quick note on economic forecasts. I've written before that economists in general are unable to predict recessions. In fact, it would be extremely strange if economists could predict recessions, just like it would be strange if engineers could predict when a bridge is collapsing. Economists are much better in making conditional forecasts, such as the following: If the Central Bank does not lower interest rates in response to the economic downturn, then a recession would most likely occur (this is conceptually similar to an engineer forecasting that a bridge might eventually collapse if the necessary repairs are not made).
As a matter of fact, economists are even unable to predict current growth rates with a great degree of accuracy. US quarterly GDP growth rates are actually quite volatile and the BEA's estimate of quarterly GDP are sometimes revised substantially even a few months after the quarter has officially ended (up to a one percentage point and occasionally even more).
While GDP data is only available on a quarterly basis, there are a bunch of economic indicators that are available at a much higher frequency, such as: The inflation rate, the unemployment rate, employment, industrial production, etc.
More recently, some of the regional branches have used this data that is available at a higher frequency to construct models that are making forecasts for quarterly GDP. The models are so-called Nowcast models. The idea is to use data that is available that becomes available throughout the quarter to make a prediction about the quarter's GDP growth rate. There are currently two different NowCast models available. GDPNow is made by the Atlanta Fed and I have written about it before. Furthermore, the New York Fed has also released a GDP Nowcast model.
Since GDPNow by the Atlanta Fed and the Nowcast published by the New York Fed are based on different models, they also release different forecasts for estimates of quarterly GDP. Below I have reproduced the evolution of the two Nowcast models for the third quarter of 2017.
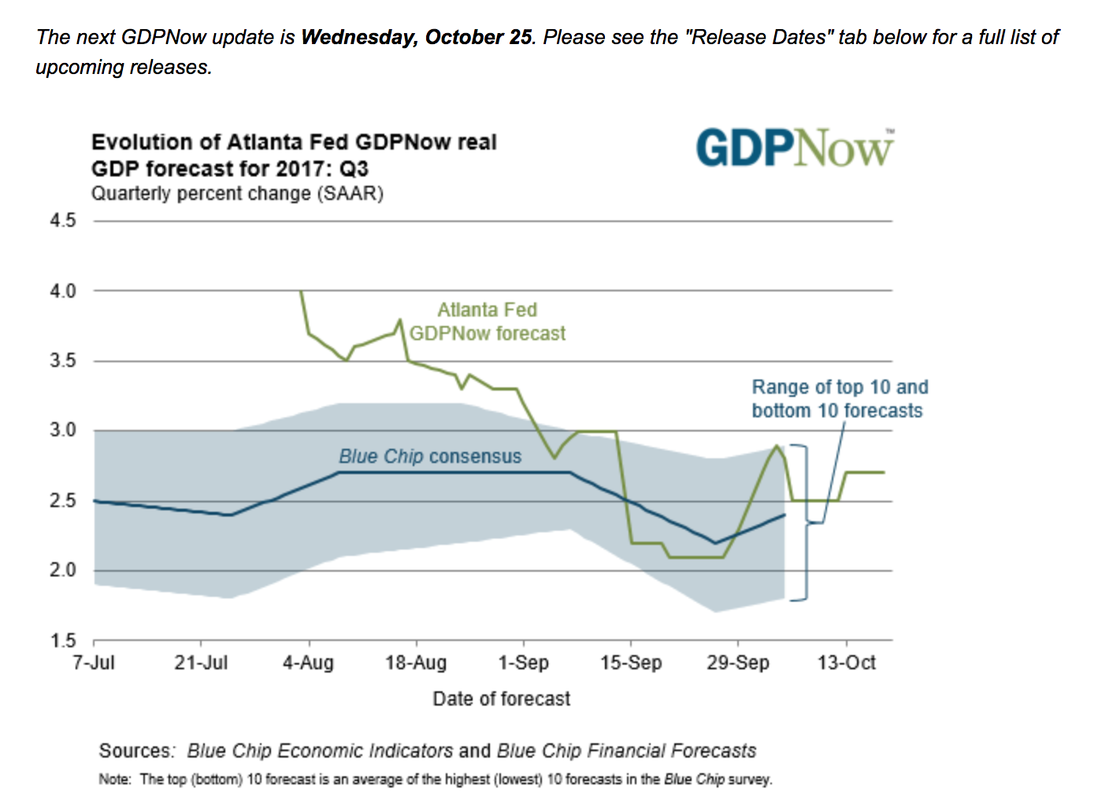
Atlanta GDPNow model
New York Fed Nowcast
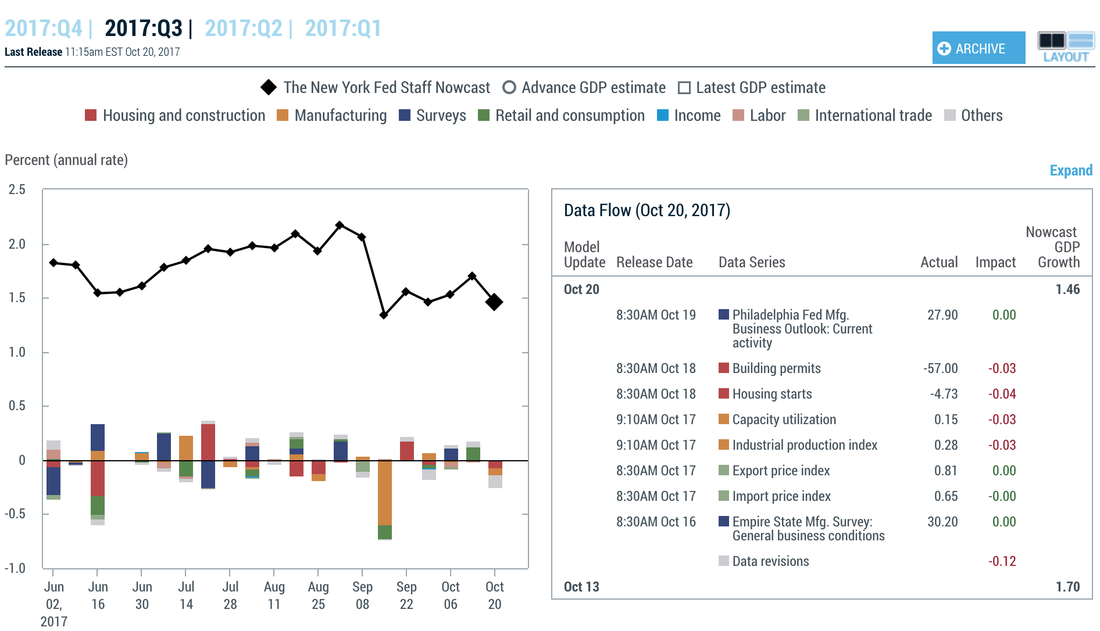
One can see that the Atlanta GDPNow has been continuously more bullish for Q3 GDP than the New York Fed's forecast. Furthermore, while the GDPNow shows a downward trend from July to the beginning of September, the New York Fed's model shows a slight upward trend over the same time period.
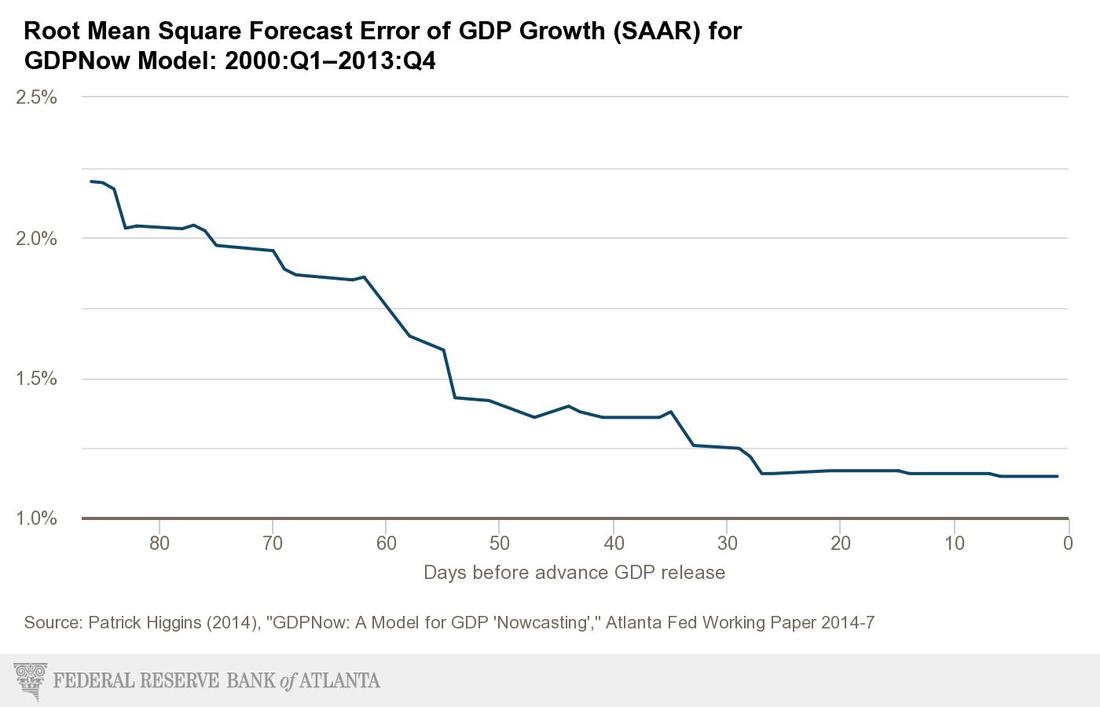
One should note though that in the case of the GDPNow series the model becomes increasingly more accurate over time as the quarter approaches its end.
One should note though that in the case of the GDPNow series the model becomes increasingly more accurate over time as the quarter approaches its end.
Furthermore, both series display a dip in the quarterly forecast in the middle of September, the result of bad incoming data (looks like manufacturing was the culprit, at least in the case of the NY Fed's forecast), with a subsequent increase by the end of the month and the beginning of October.
I did a short analysis about the two models and their relative accuracy. I have also included estimates from the Economic News Index released by the St. Louis Fed. This index is constructed quite differently from the two Nowcast models and we will see below that its performance in terms of forecast accuracy is much lower. The St. Louis model is based on an index of "economic surprise", i.e. to what extent incoming macroeconomic data has come in stronger, weaker, or as expected during the current quarter relative to the consensus forecast.
For the GDPNow index, all the data is actually publicly available on the Atlanta Fed's Website. I compare the latest GDP Nowcast estimate that comes out to the actual GDP figures in each quarter. The Atlanta GDPNow was first introduced in the third quarter of 2011 whereas the New York Fed's forecast model only dates back to the 2nd quarter of 2016.
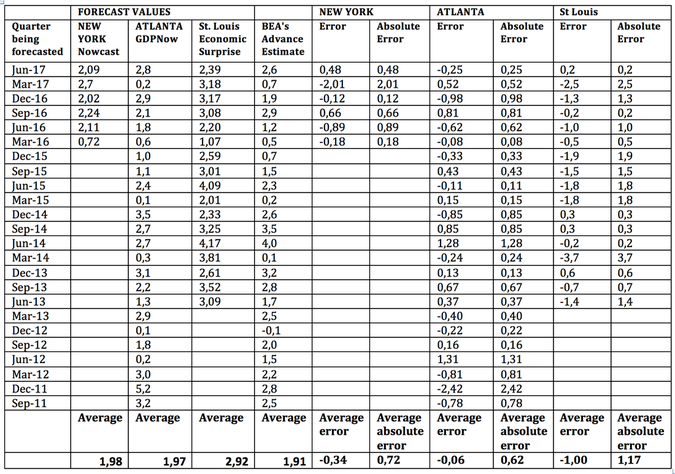
I have quickly computed the average error as well as the average absolute error for the different models. One can see that the St. Louis model performs relatively poorly. It's average absolute error is more than one percentage point. Furthermore, the model seems to be quite biased as it consistently produces higher forecasts than the actual GDP data (on average, it's forecasts are one percentage point too high.
The two other Nowcast models produce much better results with the Atlanta Fed's model preforming slightly better than the New York Fed's model.
One can see that the average error for GDPNow (the Atlanta model) is close to zero. This is good insofar as it means that the model does not consistently produce biased forecasts, i.e. on average it seems to undershoot just as as many times as it overshoots the actual GDP figures.
The New York Fed's forecast model, on the other hand, seems to consistently produce somewhat higher estimates than the actual GDP figures (it overshoots by about 0.3%). A word of caution though is in order. This is based on just a few data points since the model only goes back to 2011. In terms of average absolute forecast errors, the models are quite similar to each other.
Based on the 6 past quarters available (Q1 2016 - Q2 2017), the correlation between the two forecasts is only 14.7%. The correlation between the two forecast errors is -5%. 'The low correlation between the two forecasts as well as the two respective forecasts errors means that one can actually get a more accurate picture of quarterly GDP growth using information contained by both forecasts.
I thus ran a quick and dirty regression of quarterly GDP growth on both GDP Nowcasts, omitting the intercept. Unfortunately, there are only 6 quarters of available data for now, but this is what comes out of my regression:
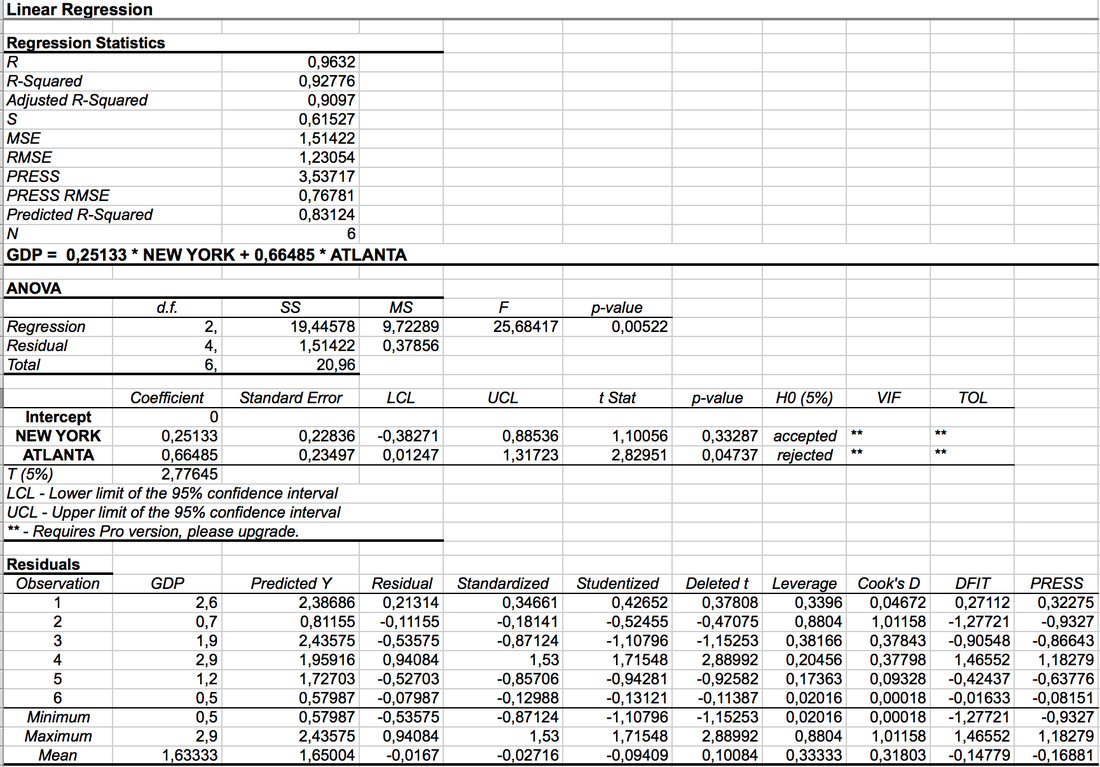
One can see that for the last 6 quarters the most accurate quarterly GDP forecast would be a weighted average of the two models with a weight of about 0.66 for the Atlanta model and a weight of about 0.25 for the NY Fed's model (even though the second coefficient is not statistically significant). This weighted average produces a very small average absolute forecast error of about 0.4% and thus produces more accurate forecasts than any of the two Nowcast models on their own. This is not very surprising in the sense that more information usually leads better forecast results, given that the information is accurate and helpful. Note, however, that the coefficient for the NY Fed forecast is not statistically significant.
On the other hand, incorporating the St. Louis forecast as a third forecast into my model does not seem to produce more accurate results as the average absolute forecast error actually increases to 0.41, this being a result of the St. Louis model producing biased and inaccurate forecasts (see regression below).
Note that all coefficients are now statistically insignificant. This, however, is a result of the very small sample size (only 6 quarters are available), which greatly reduces the statistical power.
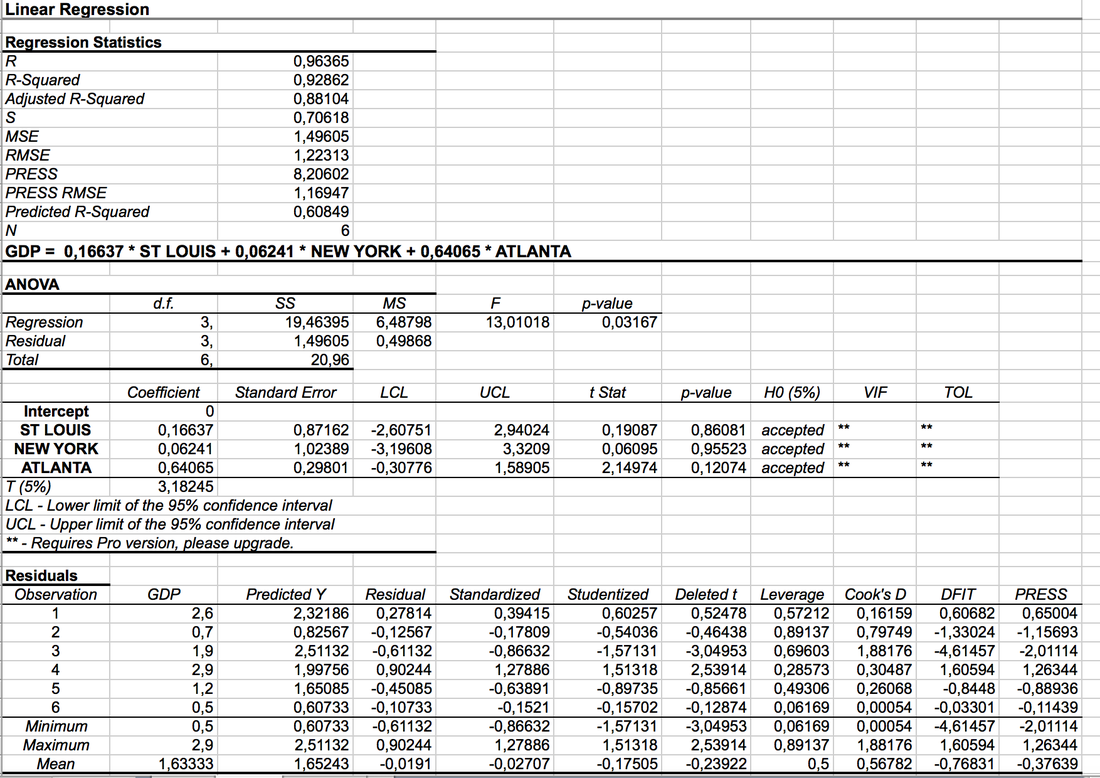
According to the two regressions performed above, one can expect quarterly GDP coming in at about 2.15 and 2.34%, respectively:
MODEL 1: 0.25*1.46% + 0.66* 2.7% = 2.15%
MODEL 2: 0.17*3.13% + 0.06*1.46% + 0.64* 2.7% = 2.34%
Forecasts as of October 23rd:
St. Louis Forecast: 3.13%
New York forecast: 1.46%
Atlanta forecast: 2.7%
So my models predict that Q3 GDP should come in at slightly above 2%. We will see how accurate this forecast will be when the actual figure will be released by the BEA later next week.

 RSS Feed
